Cockpit
How the business is doing, in nine numbers.
Cockpit is the page you land on, and it answers one question: how is the business doing. It is a reading, never a worklist — nothing here is waiting for you to act on it. What needs doing lives in the Inbox and in Appointments.
Nine numbers, three rows
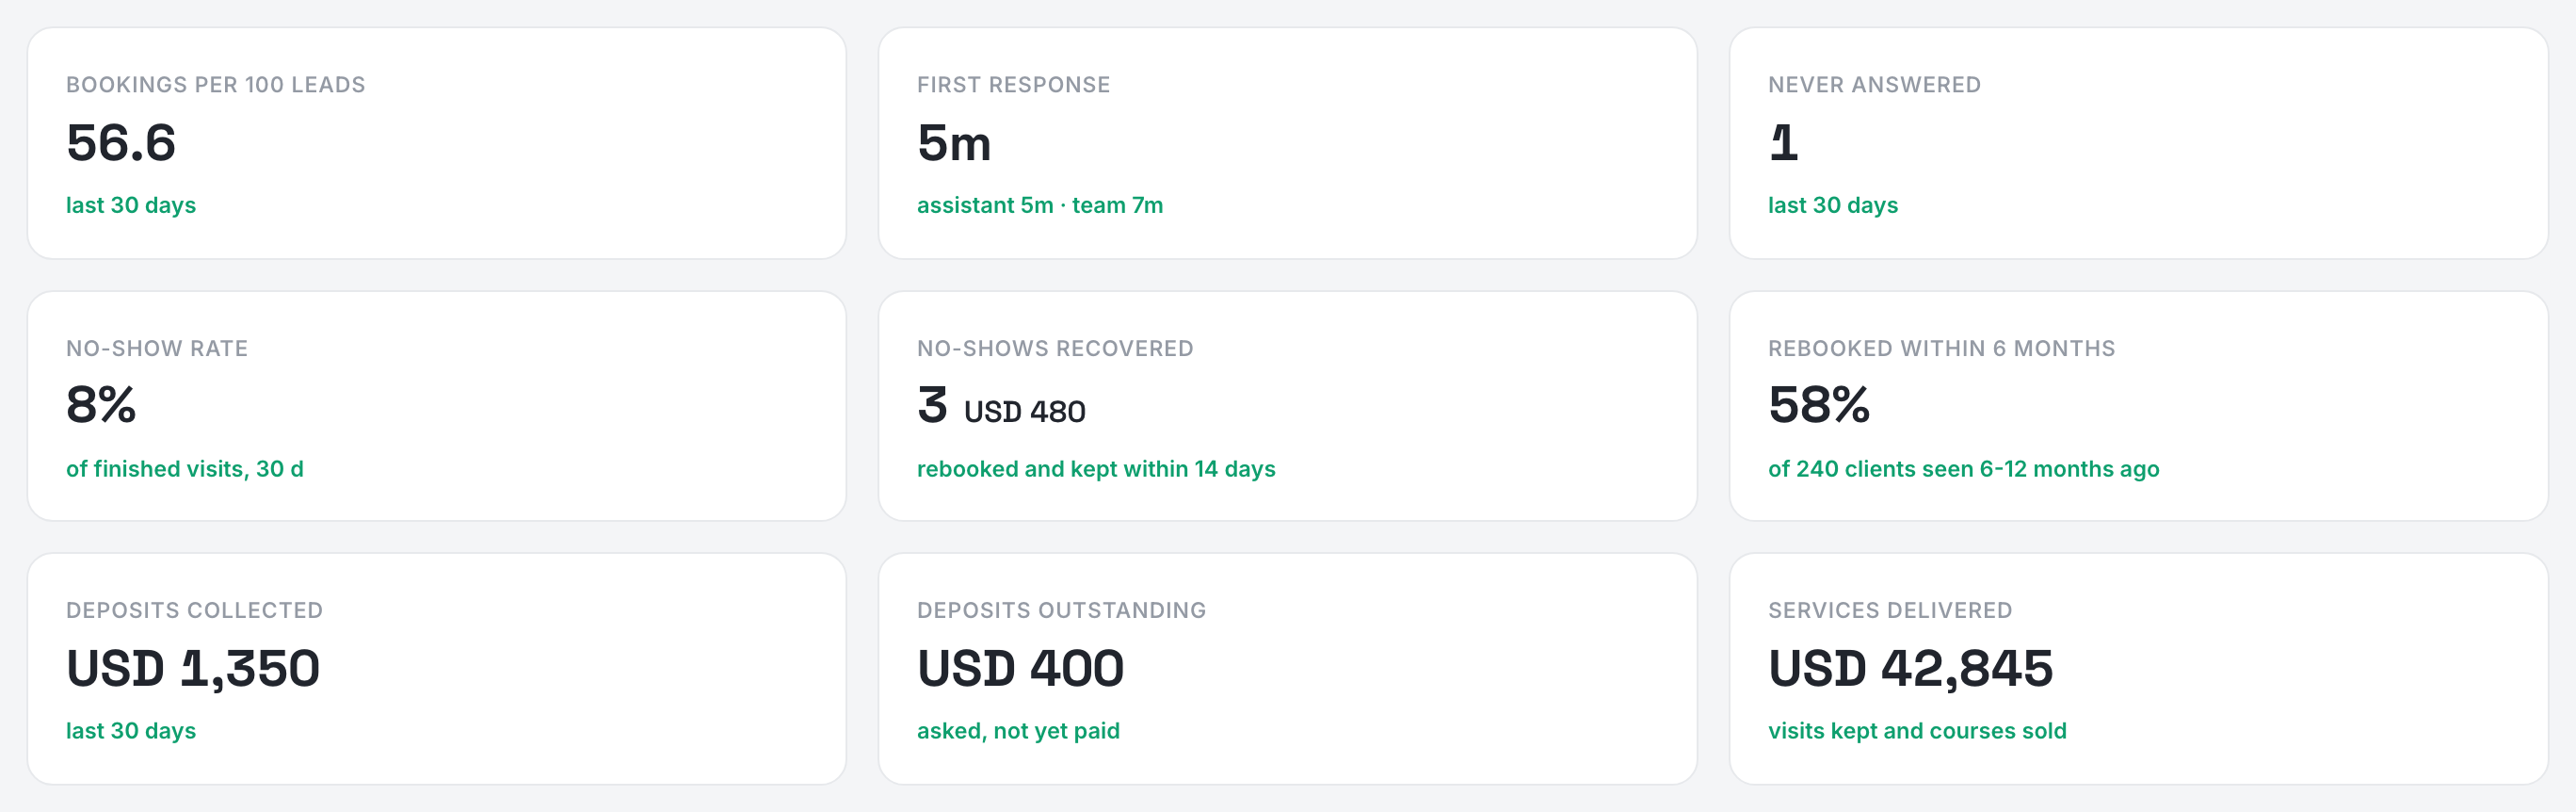
The rows are the reading: getting them booked, keeping the visit, and what came in. Nothing labels them — the spacing does, so the eye groups them without a heading telling it to.
Row one — getting them booked
- Bookings per 100 leads — appointments made against inquiries received over the last 30 days. Not a percentage: it is a count of bookings, and it is the number the whole product is judged on.
- First response — how long a client typically waits for their first answer. The MEDIAN, not the average, so one conversation answered three days late does not speak for the usual case; one sample per conversation, so a live chat's back-and-forth is not counted as ten first responses. The line underneath splits the assistant from your team, and the gap between them is the point.
- Never answered — conversations from the last 30 days whose first message never got a reply, including the ones since closed. It is the uncomfortable one, which is why it is on the page rather than in a report.
Row two — keeping the visit
- No-show rate — of the visits that finished in the last 30 days, the share that did not happen.
- No-shows recovered — a client missed an appointment, booked again within 14 days, and that later appointment was KEPT. Counted per client, so two misses and one return is one recovery. The amount beside it is what those visits were worth, taken from the price recorded on the appointment.
- Rebooked within 6 months — of the clients seen between twelve and six months ago, the share who came back within six months. The cohort is old on purpose: six months has to have passed for the question to have an answer.
Row three — what came in
- Deposits collected — deposits that actually settled in the last 30 days. What was DEBITED, not what was asked: an amount edited between the ask and the payment would otherwise be counted as revenue that never arrived.
- Deposits outstanding — asked and not yet paid. The one number here that is not a statistic: it is a list of people to chase, which is why it links into Appointments.
- Services delivered — visits that happened, at the price recorded on them, plus courses sold in the window. NOT a sum of payments: most of a clinic's money is handed over at the desk and never passes through us, so counting only what we saw would report a fraction of the month and read as a collapse.
The funnel, and where people come from
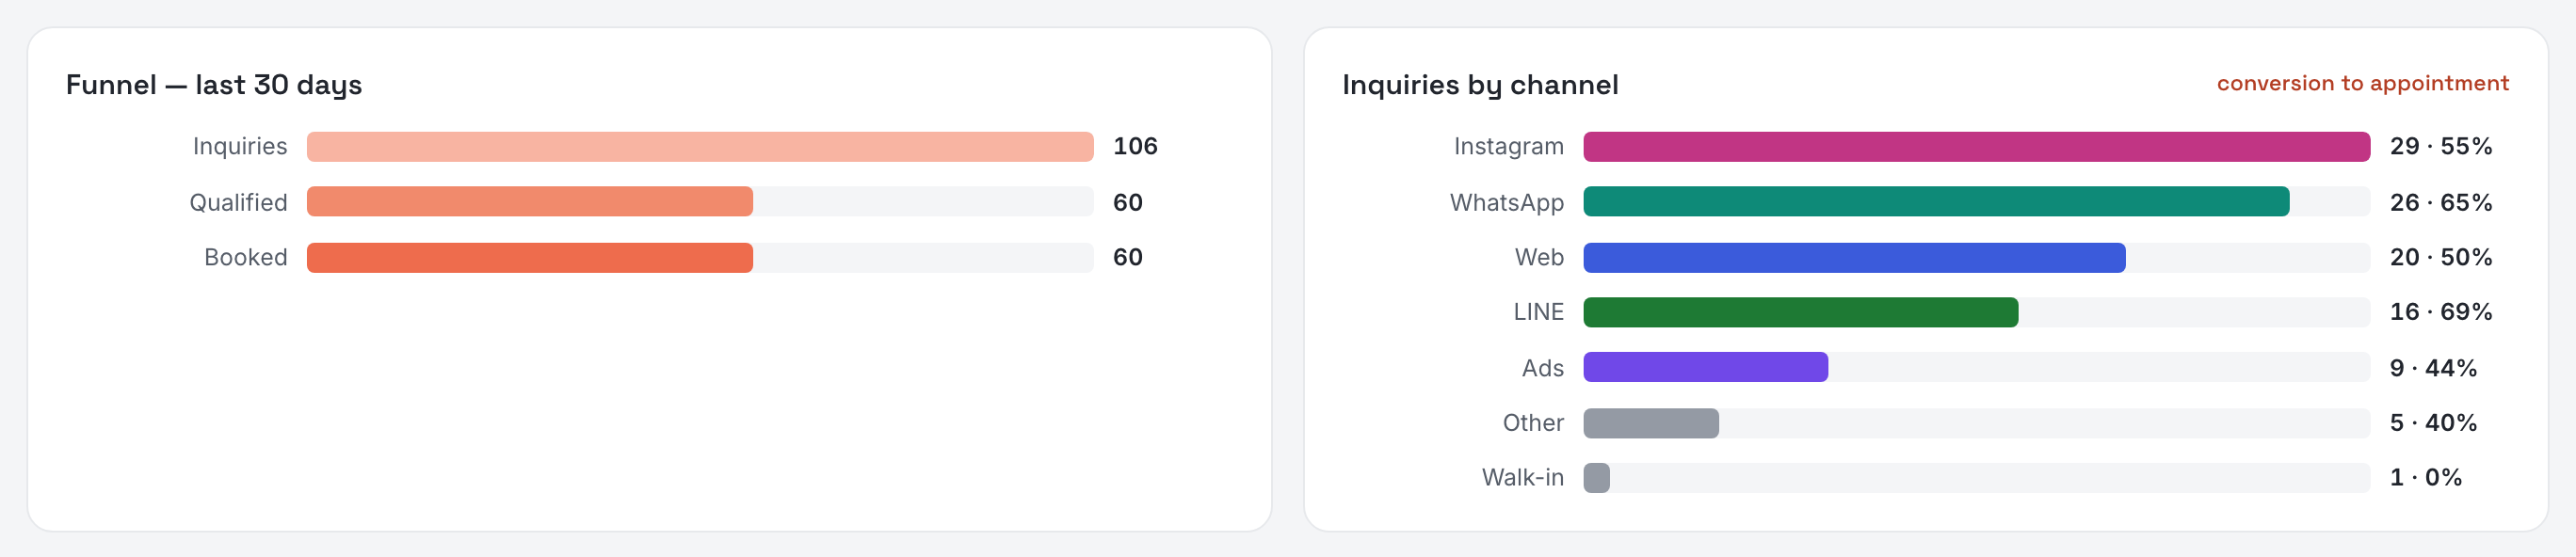
Inquiries, qualified, booked over 30 days — and beside it, inquiries by channel, each with its own conversion to appointment. That second panel is where you find out that the channel bringing the most people is not the one bringing the most clients.
Volume, and what sells
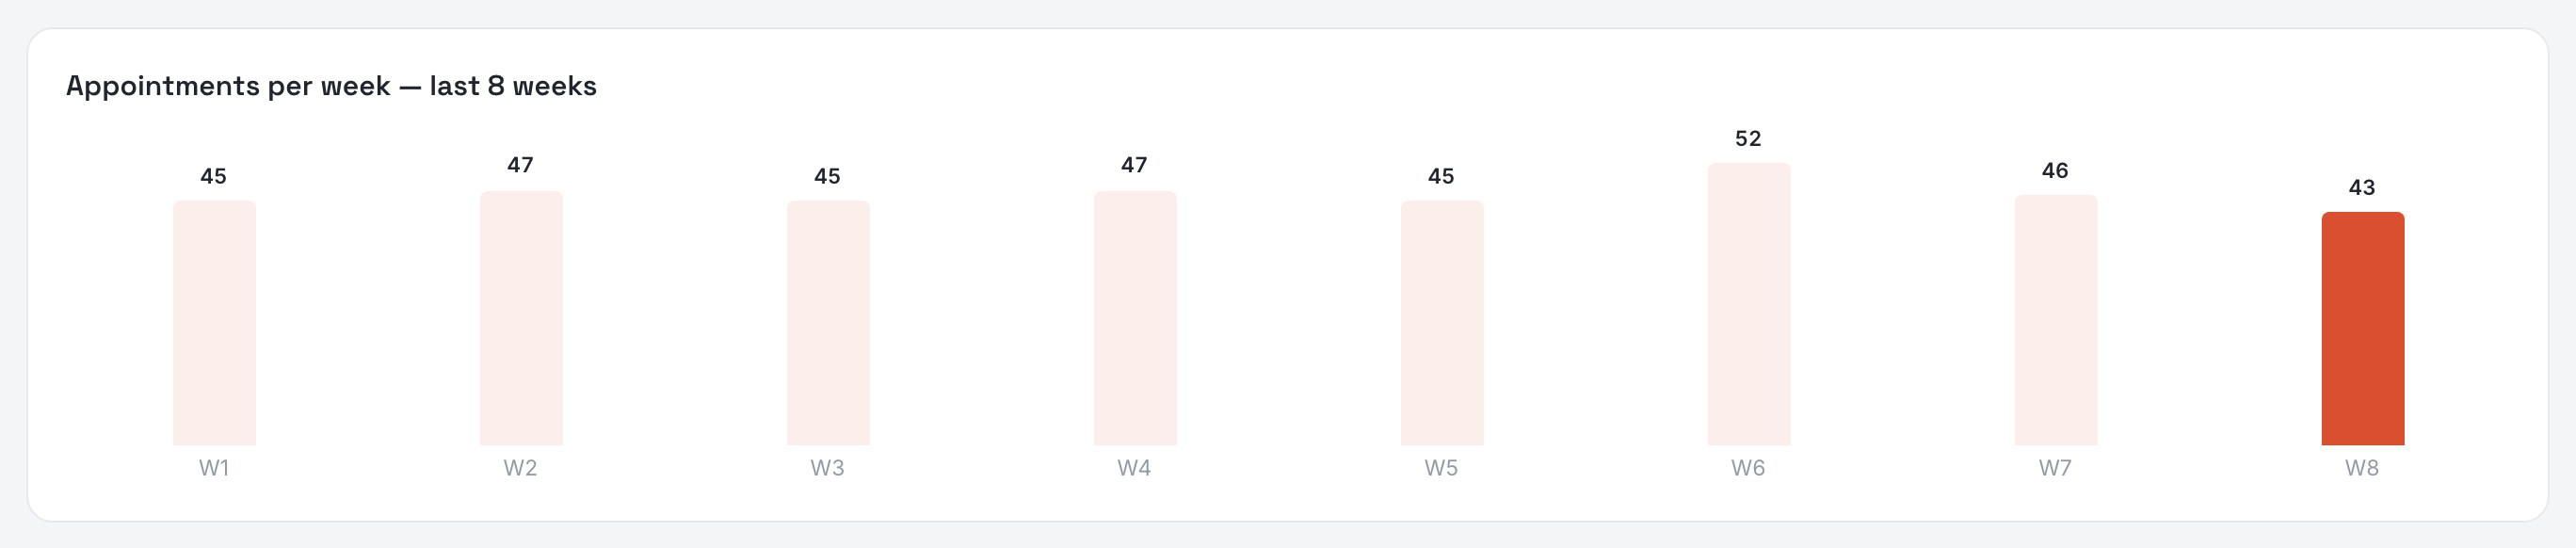
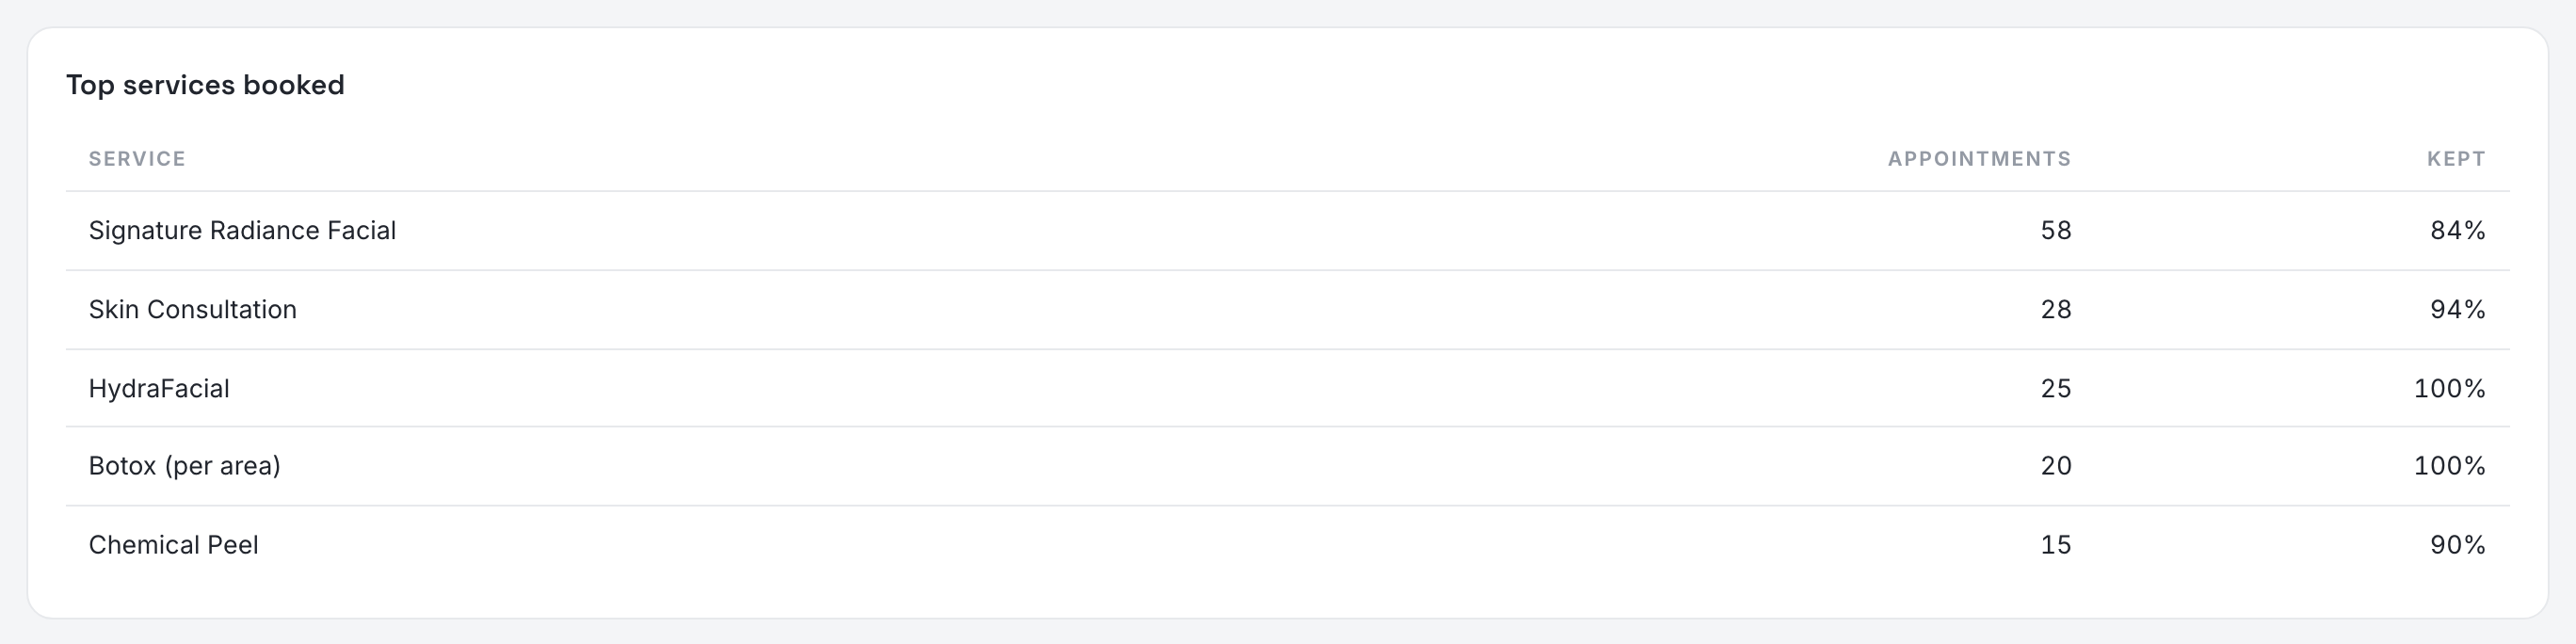
Appointments per week over eight weeks, then your top services with how many of each were kept. The kept share is the useful column: a service booked often and kept rarely is a scheduling problem, not a popular treatment.
Your landing page
Visits, bookings started, and the conversion between them, over 30 days, with where the visitors came from. It appears once you have a landing page live.

Packages
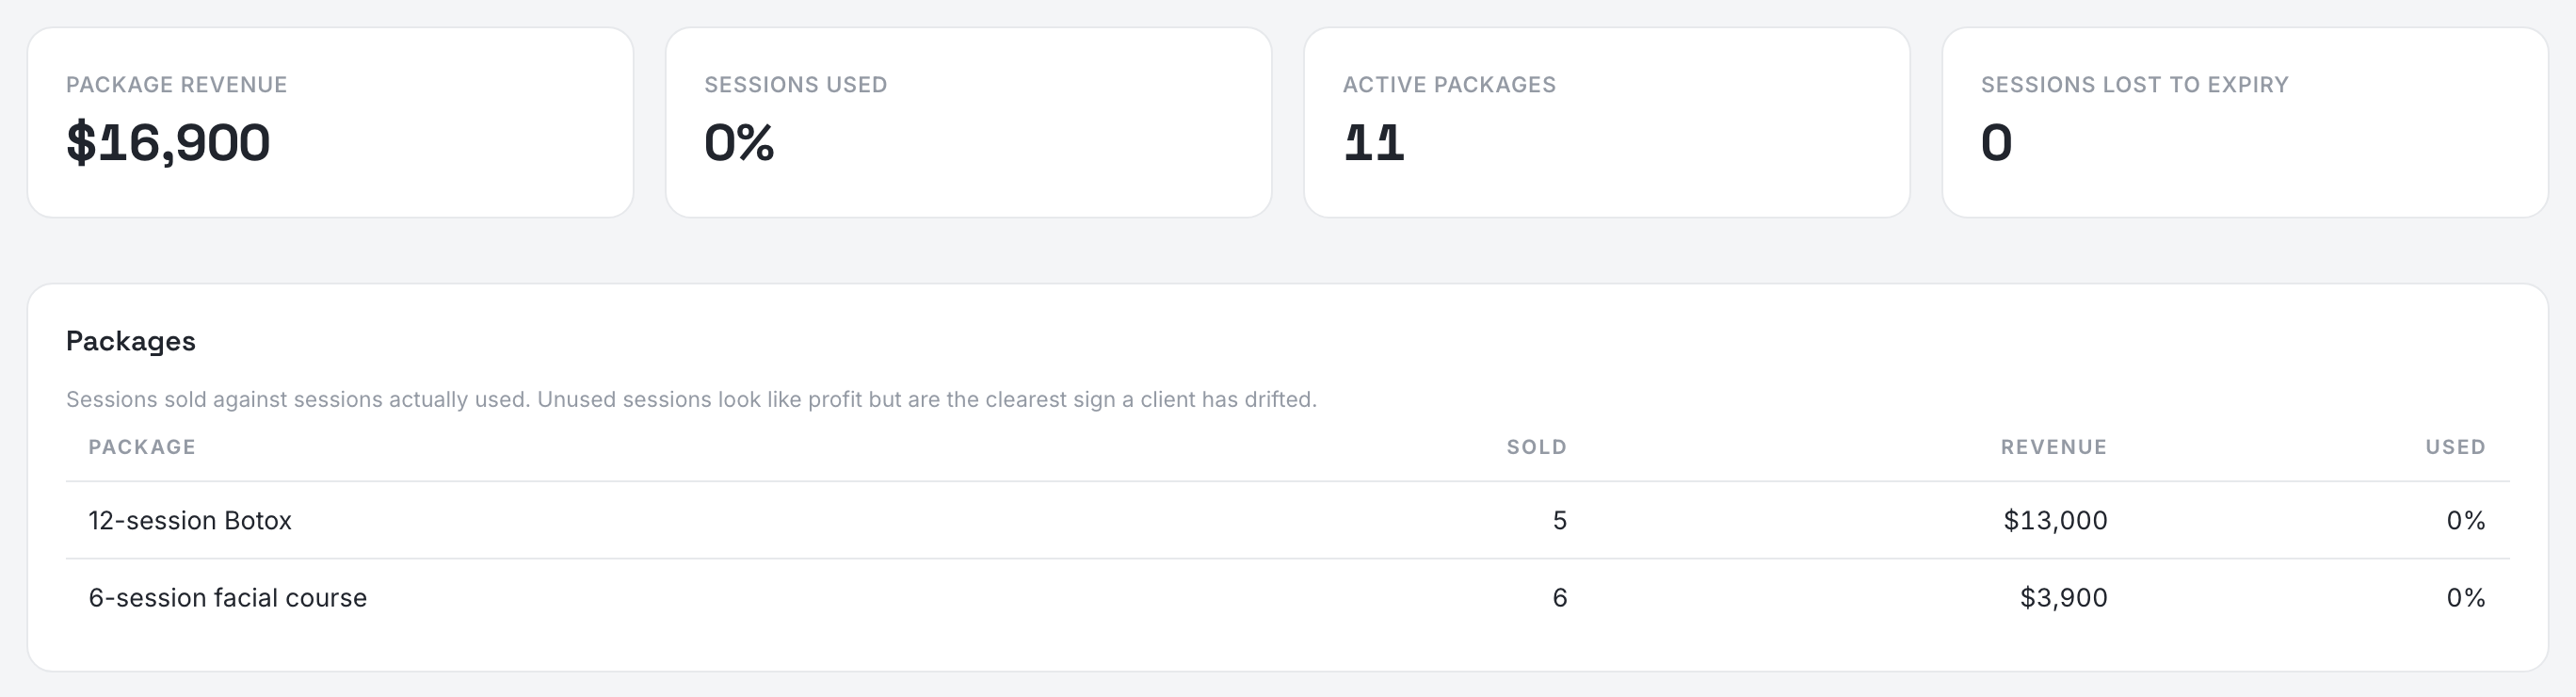
What has been sold and what is left to deliver. Sessions sold against sessions actually used: unused sessions look like profit and are the clearest sign a client has drifted, which is what makes this panel worth reading rather than counting.
What the outside world did with what you published — your landing page and your social accounts — is next door, in Analytics.